- Reproducibility: Teams can reproduce experiments, models, and results for debugging, experimentation, and validation.
- Version control: Track changes to artifacts over time so that teams can revert to previous data or model versions when needed.
- Auditing: Maintain a detailed record of artifacts and transformations to support compliance and governance.
- Collaboration: Improve teamwork by making experiment history transparent, reducing duplicated effort, and accelerating development.
View an artifact’s lineage graph
To view an artifact’s lineage graph:- Navigate to your project’s workspace in the W&B App.
- Click the Artifacts tab in the project sidebar.
- Select an artifact, then click the Lineage tab.
Navigate lineage graphs
The lineage graph is a visual representation of the relationships between artifacts and runs in an ML experiment. Use the W&B App UI or the Python SDK to explore and traverse an artifact’s lineage graph.- W&B App UI
- W&B Python SDK
Nodes with green icons represent runs. Nodes with blue icons represent artifacts. Arrows between nodes indicate the input and output of a run or artifact.Artifact nodes display the artifact’s name along with the version of the artifact in the form Run nodes display the run’s name.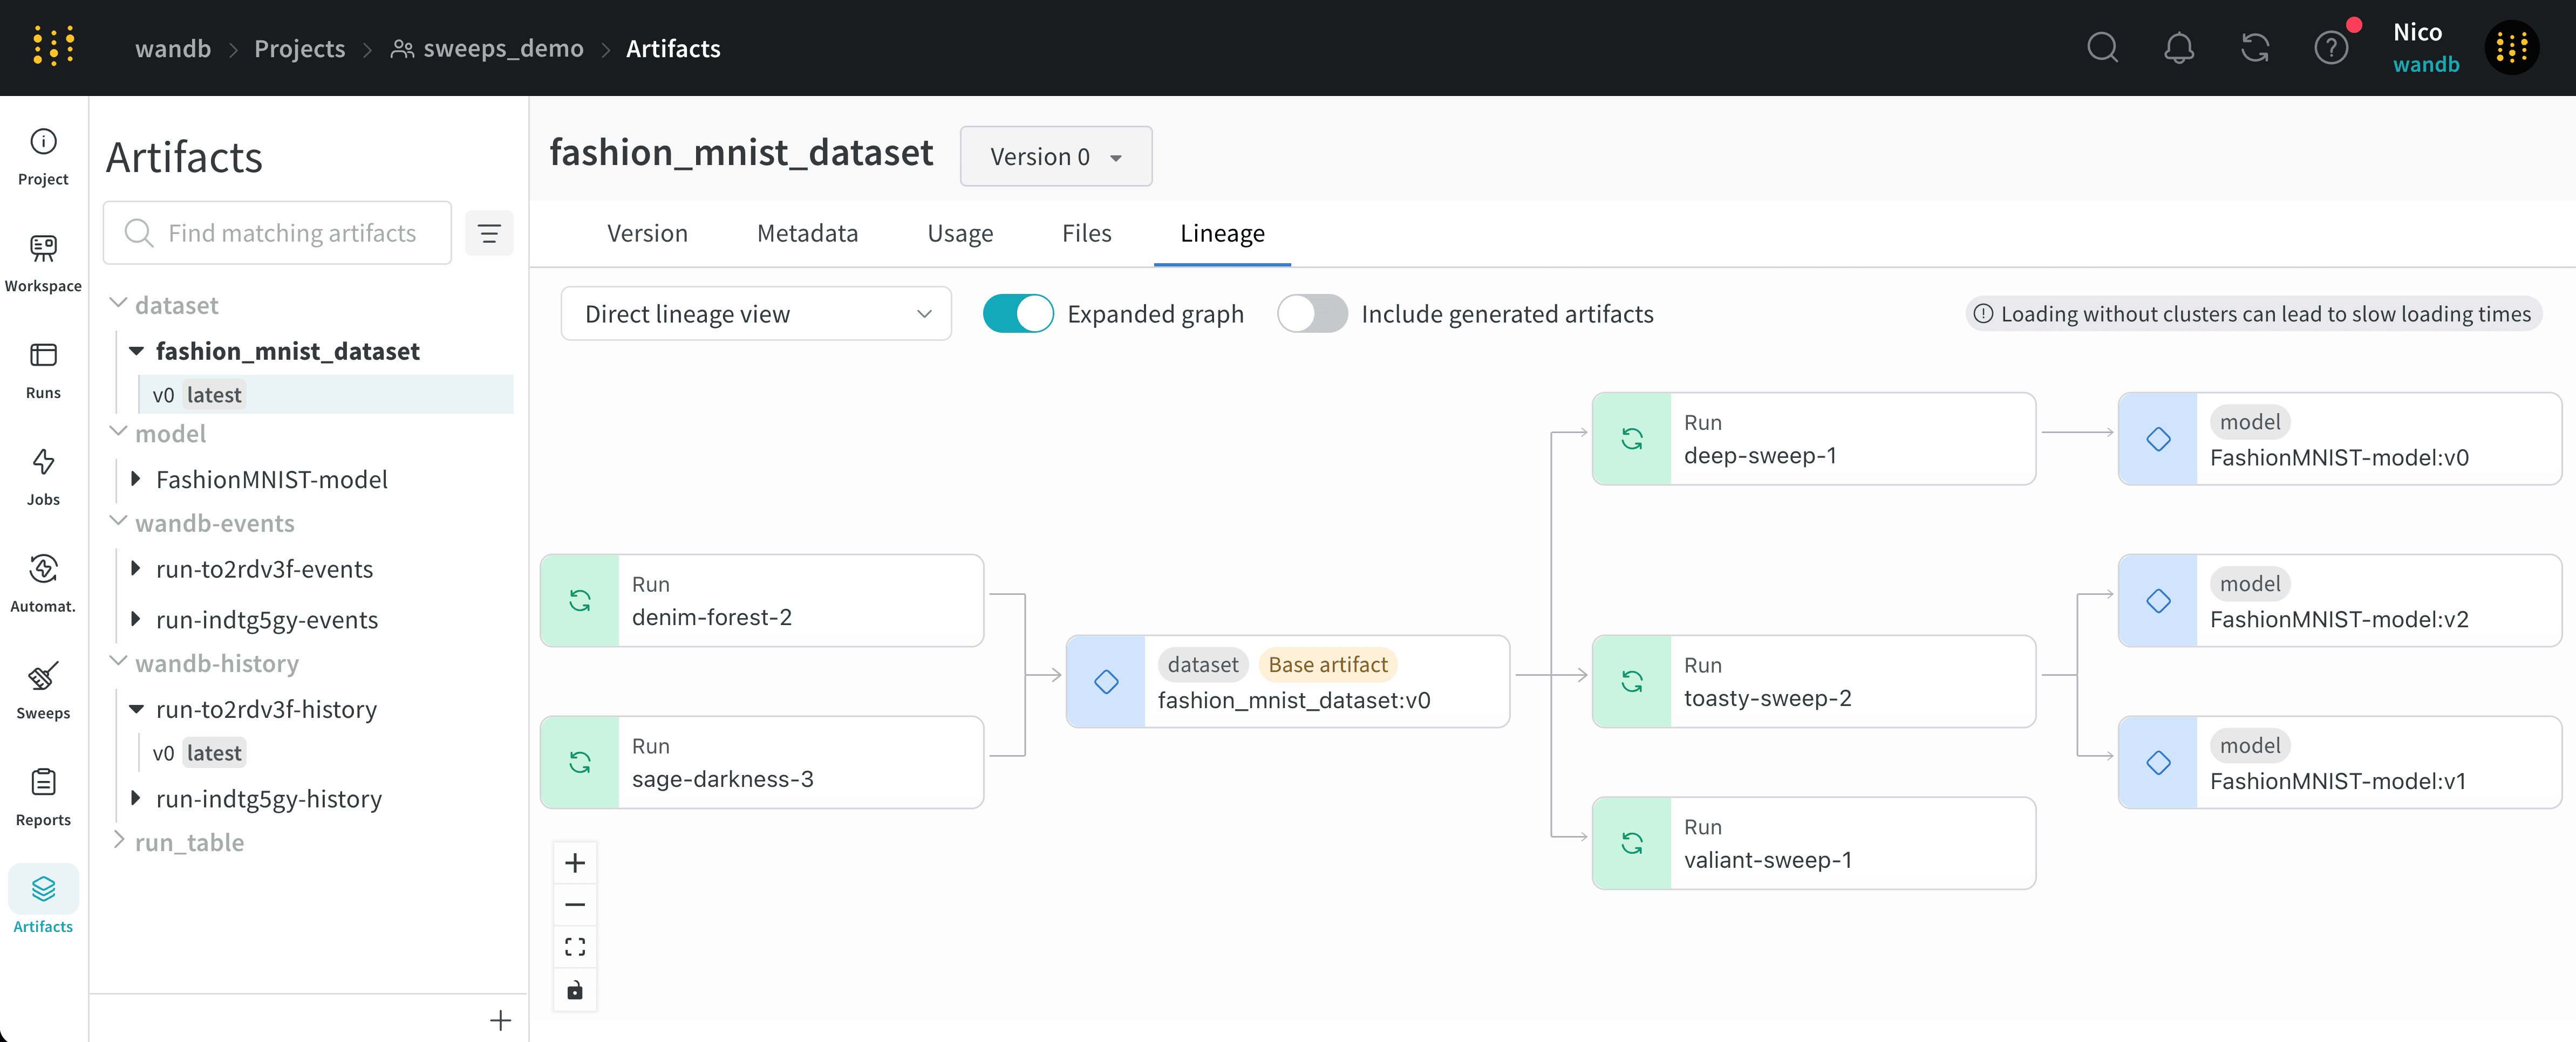
[ARTIFACT_NAME]:[VERSION]. The artifact’s type appears above the name of the artifact.You can view the type and the name of an artifact in both the left sidebar and in the lineage graph node.
Enable lineage graph tracking
To enable lineage graph tracking, you must mark artifacts as inputs or outputs of a run using the W&B Python SDK. The following sections describe how to mark each.Track the input of a run
Mark an artifact as the input (or dependency) of a run with thewandb.Run.use_artifact()
method. Specify the name of the artifact and an optional alias to reference a specific version of that artifact. The name of the
artifact is in the format [ARTIFACT_NAME]:[VERSION] or [ARTIFACT_NAME]:[ALIAS].
Replace the bracketed placeholders with your values:
Track the output of a run
Usewandb.Run.log_artifact() to declare an artifact as an output of a run. First,
create an artifact with the wandb.Artifact() constructor. Then, log the
artifact as an output of the run with wandb.Run.log_artifact().
Replace the bracketed placeholders with your values:
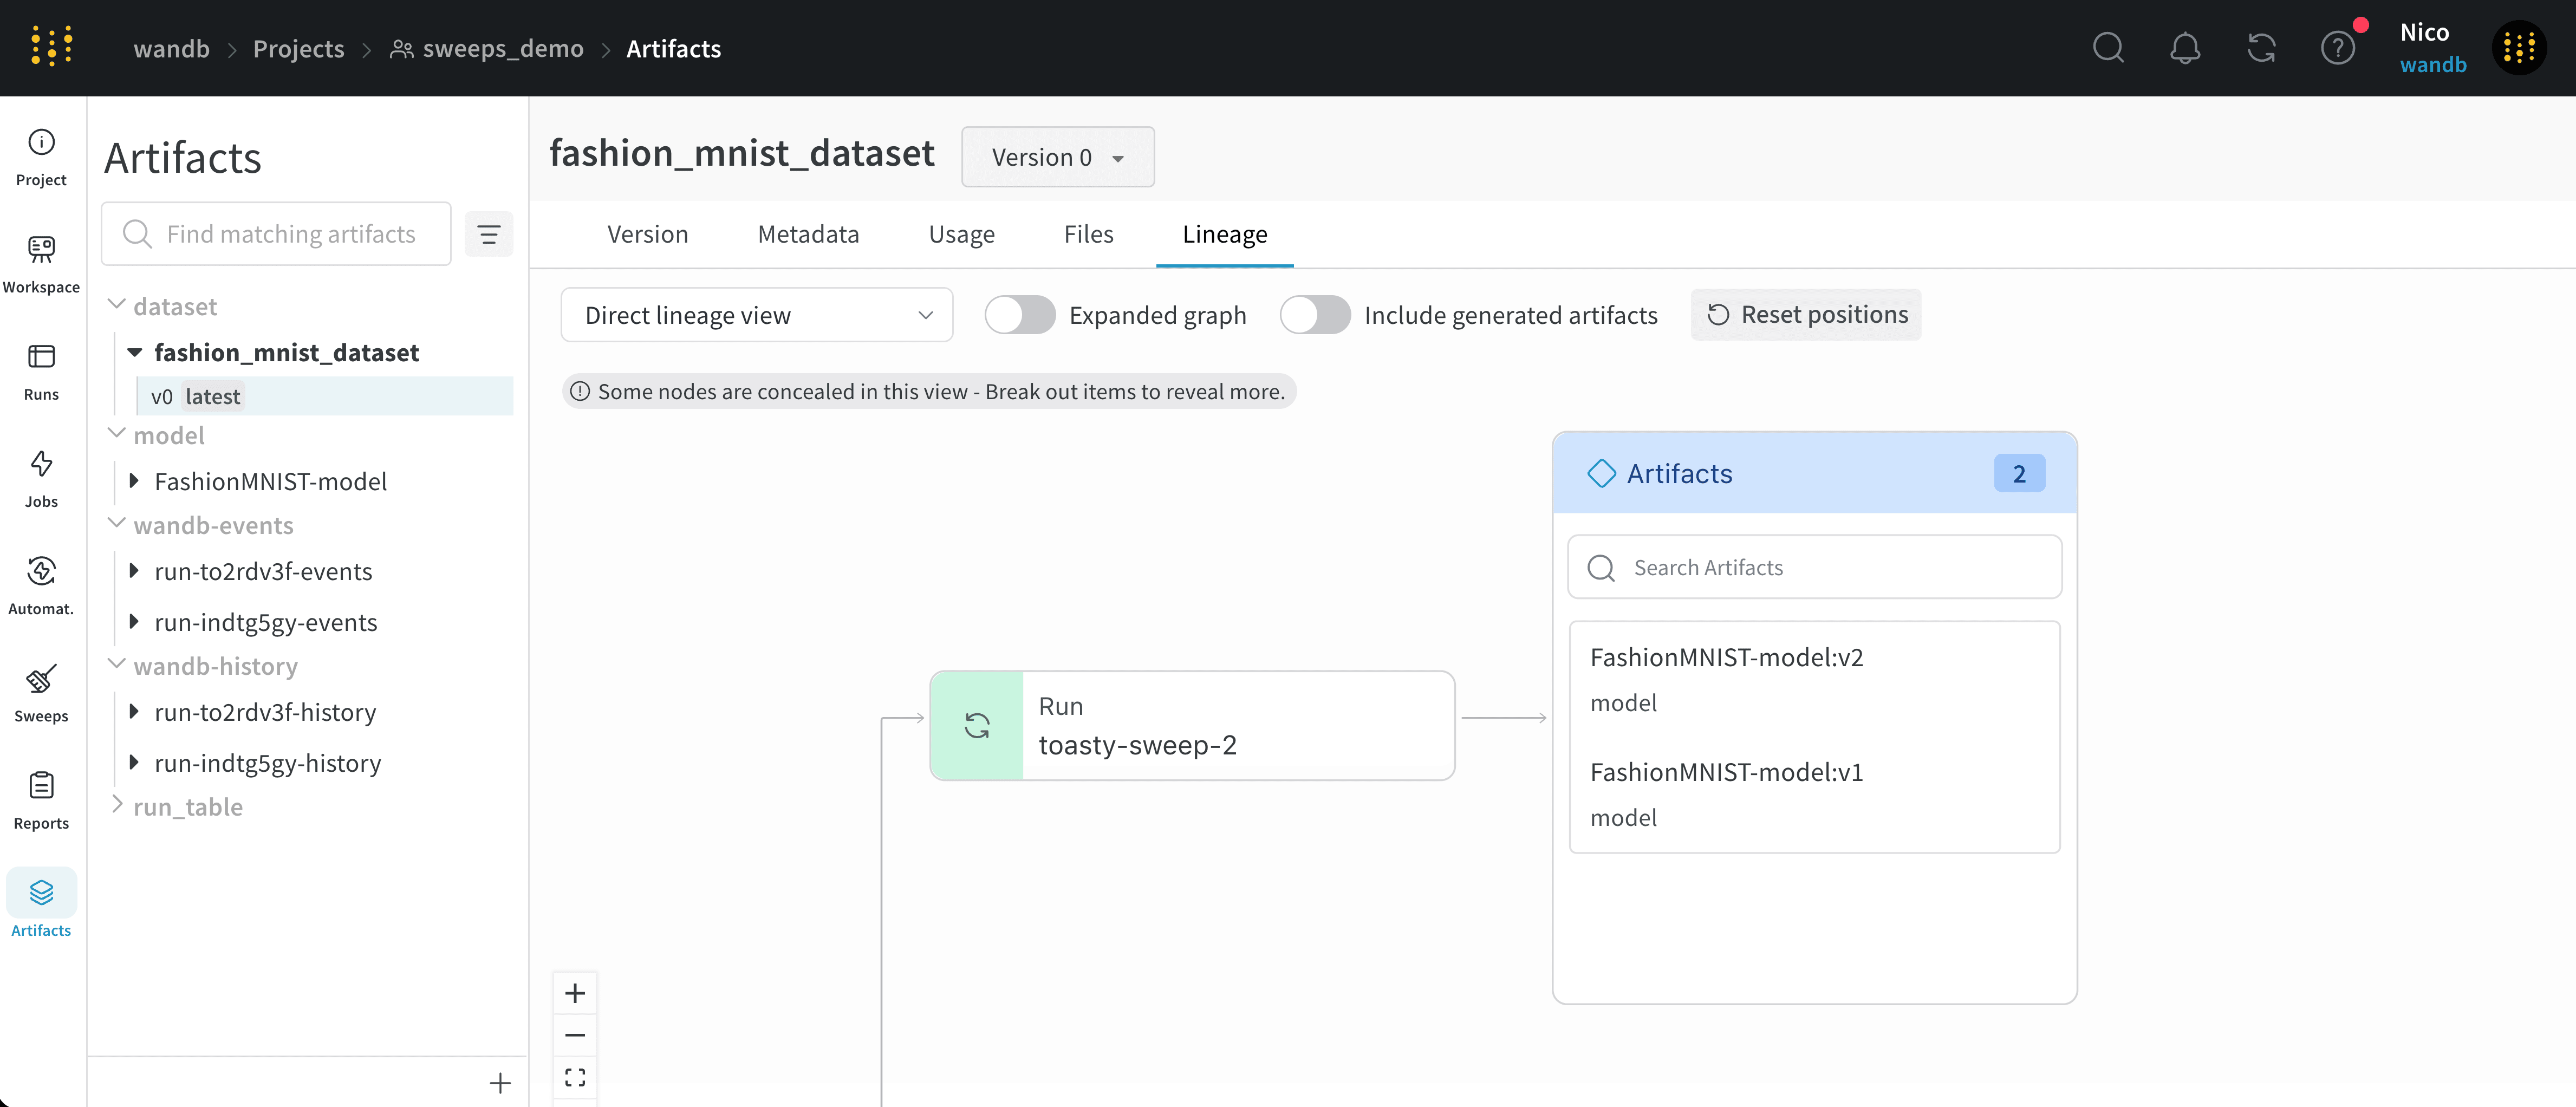
Artifact clusters
To keep large lineage graphs readable, W&B groups dense levels of the graph into clusters that you can search and expand. When a level of the graph has five or more runs or artifacts, W&B creates a cluster. A cluster has a search bar to find specific versions of runs or artifacts and lets you pull an individual node from a cluster to continue investigating the lineage of a node inside a cluster. Click a node to open a preview with an overview of the node. Click the arrow to extract the individual run or artifact so you can examine the lineage of the extracted node.